Data Engineer · Riyadh
Yazeed
Almuhlaki
I build pipelines that move data from raw to serving. Ingestion, modeling, and quality gates for national-scale Saudi data.
Core Skills
SQL
Python
ETL / ELT
Data Modeling
Data Lake Design
Airflow
About
I build reliable systems for data.
I’m a Data Engineer focused on building pipelines that move, transform, and deliver data reliably. I work with Python, SQL, Airflow and cloud technologies, with hands-on experience in AWS, to turn raw data into data people can trust.
Skills
Data Engineering
SQLPythonETL / ELTData ModelingData Warehouse DesignData Lake DesignParquetPartitioningIncremental LoadsIdempotent LoadsData Quality ChecksAirflowDocker
Cloud and Storage
AWSAzurePostgreSQLDuckDBS3AWS Lambda AWS EventBridgeAWS SNS AWS SQS AWS DynamoDB
Selected Work
YouTube GCC Trending Platform
2026
Problem
YouTube publishes a separate trending chart per country and keeps no history, so there was no way to see what was popular across the Gulf as a region or how it changed. The flat daily files only hold the state at collection time, so a renamed video rewrites its own past.
Source
Six daily country charts from the YouTube Data API, covering Saudi Arabia, the UAE, Kuwait, Qatar, Bahrain, and Oman, at roughly 830 rows a day.
Pipeline
Scheduled a Lambda to pull all six countries into an S3 raw zone, then triggered a second Lambda from a completion manifest so the merge runs once per batch rather than once per file, joined the category lookup, flattened the response into a processed zone, and served it through Athena to a Streamlit dashboard. Those same files then load into a star schema in PostgreSQL, one row per video per region per day, with SCD Type 2 on the video and channel dimensions so each appearance keeps the title it had on its own day, and tags in a bridge table. A nine task Airflow DAG runs the daily load, every stage safe to re-run.
Quality
The merge only runs when all six countries land, and a conditional write on the ingest date keeps it idempotent under at-least-once delivery. Missing like and comment counts stay null so they do not distort averages. On the warehouse side, two gates fail the run when rows go missing in a join or an entity ends up with two current versions, which are the failures that otherwise pass silently.
PythonAWS LambdaS3EventBridgeDynamoDBSQSSNSGlueAthenaPostgreSQLAirflowDockerSQLStreamlitPlotly
STEDI Lakehouse on AWS

Problem
Raw semi-structured sensor and app data arrived from three separate sources with no curated layer to query.
Source
Semi-structured JSON from a customer website, a mobile app, and IoT devices.
Pipeline
Landed raw JSON in S3, cataloged and transformed it through AWS Glue into a landing, trusted, and curated zone structure, then served the curated tables to Athena for querying.
Quality
Records filtered at the trusted zone so that only consented customer data flows into curated tables.
AWSGlueS3AthenaPythonSparkETLLakehouse
Sparkify Data Warehouse

Problem
Raw JSON event logs in S3 were not queryable for analytics without a modeled warehouse.
Source
Raw JSON log and song metadata files stored in S3.
Pipeline
Extracted JSON from S3 into Redshift staging tables, then transformed into a star schema with a songplays fact table and users, songs, artists, and time dimensions using SQL joins and filters.
AWSRedshiftSQLPythonStar SchemaETLData Modeling
Azure Bike Share Data Warehouse
2025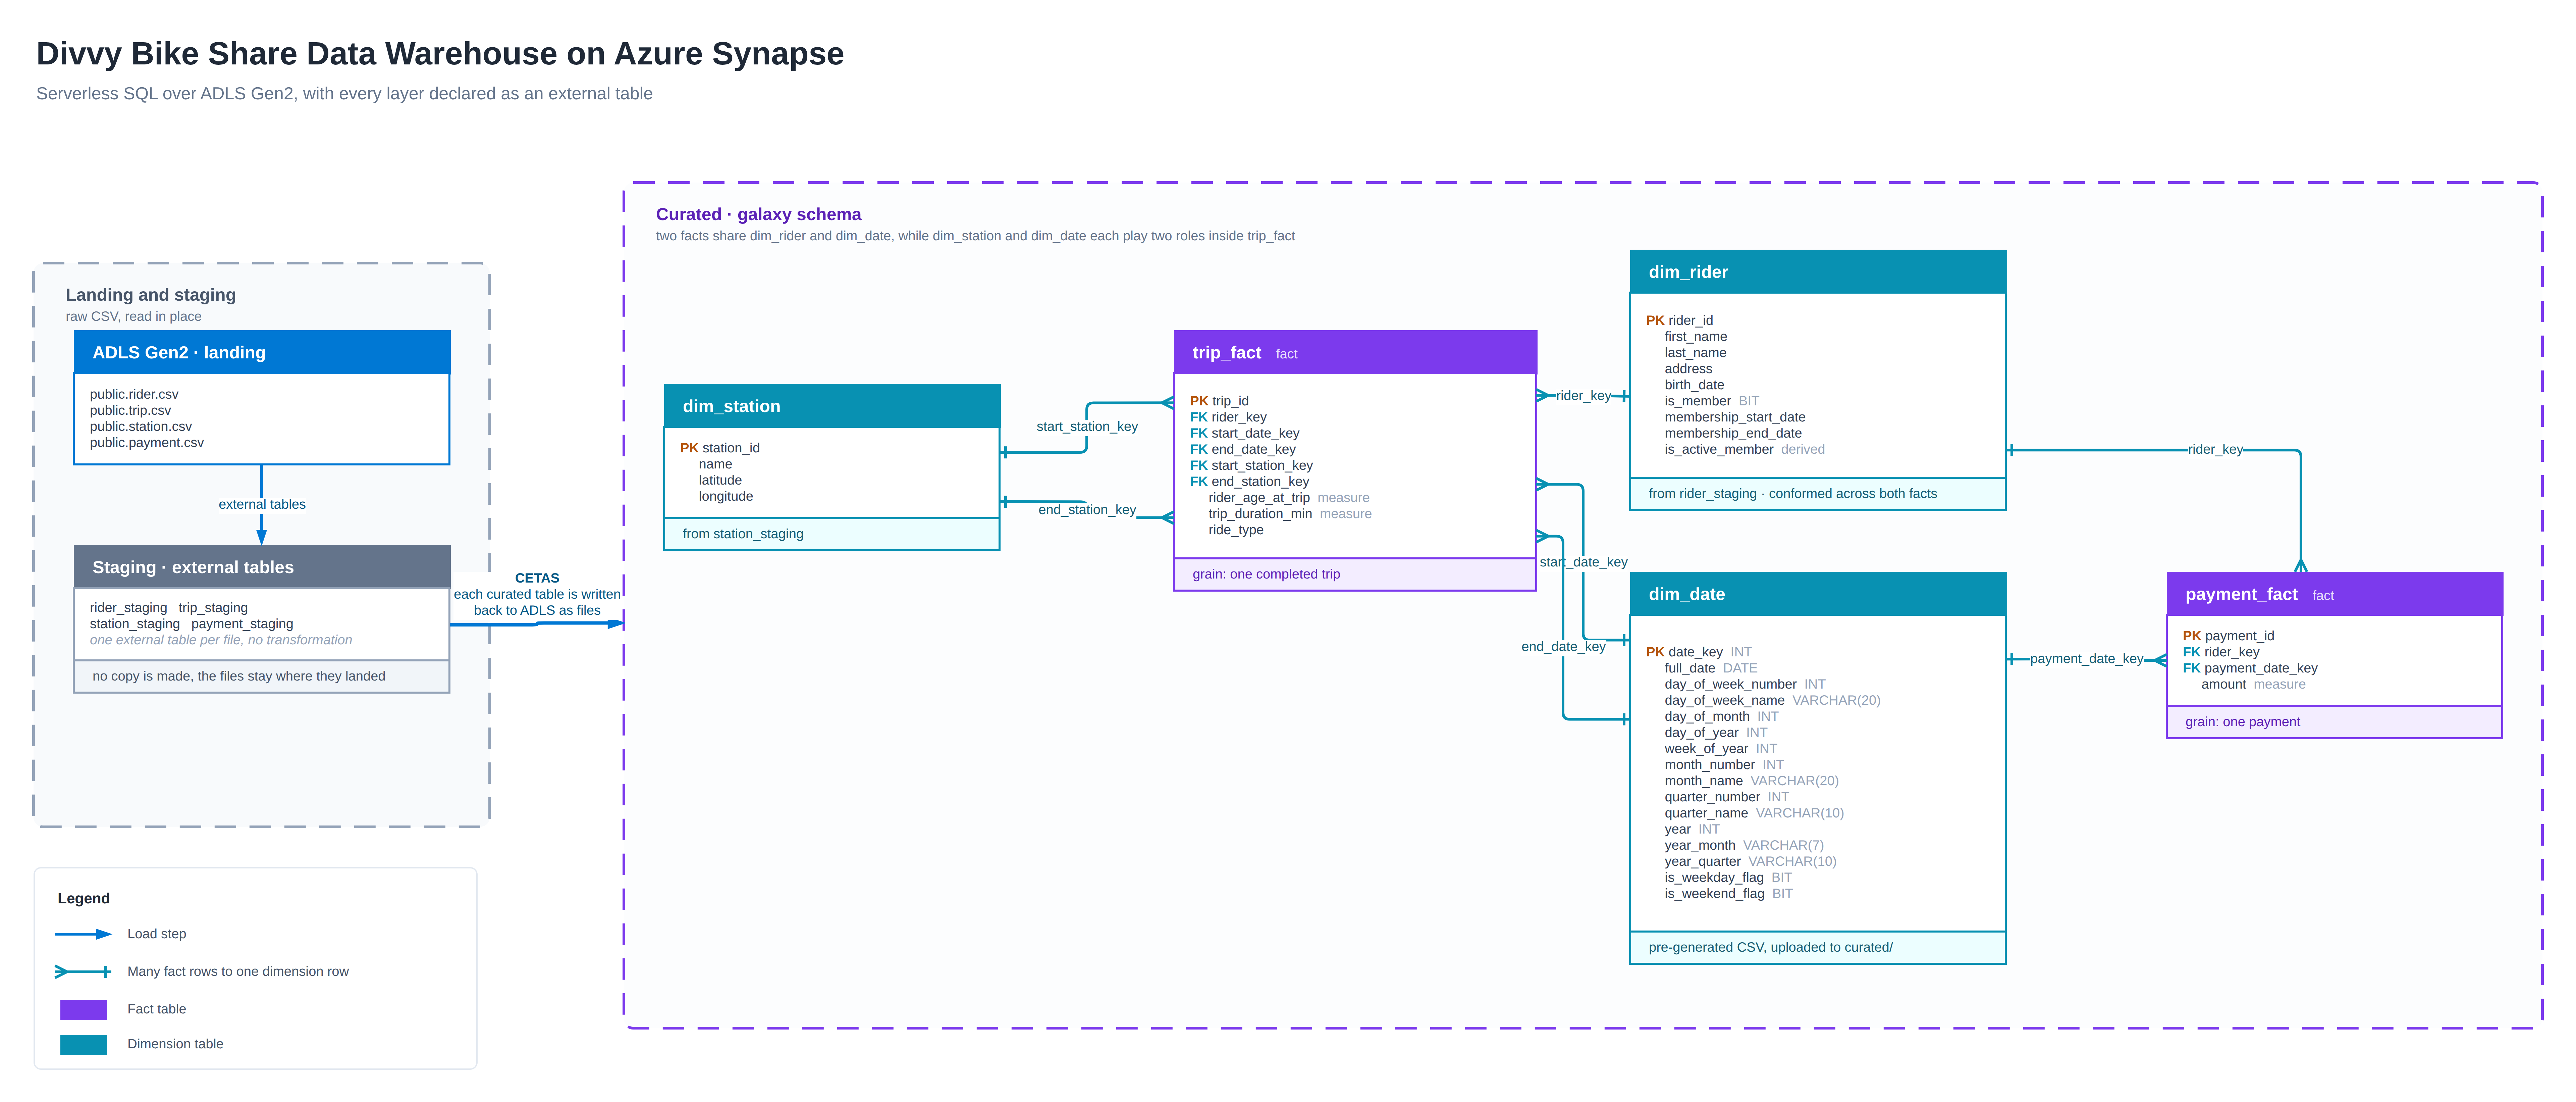
Problem
Operational OLTP records for trips, riders, stations, and payments were not shaped for analytical queries.
Source
Bike share operational data covering trip records, rider profiles, station locations, and payment transactions.
Pipeline
Modeled the operational data into a galaxy schema with separate fact tables for trips and payments sharing conformed dimensions, targeting an Azure Synapse analytics environment.
AzureSynapseSQLData ModelingGalaxy SchemaDimensional Modeling
KSA Dust Health Risk
Problem
Aerosol and population data existed in incompatible raster grids with no governorate-level output.
Source
NASA MERRA-2 aerosol optical depth rasters and WorldPop 2020 population rasters, covering 147 Saudi governorates.
Pipeline
Ingested both raster sources, aligned them to a common grid, computed a weighted Dust Respiratory Exposure Index per cell, then aggregated to governorate boundaries as the serving layer.
PythonRaster ProcessingGeospatialETL
Certifications
Data Analyst Nanodegree
Udacity
2026
Programming for Data Science with Python
Udacity
2025
Spatial Data Science Bootcamp
Tuwaiq Academy
2026
Linear Algebra for Machine Learning and Data Science
DeepLearning.AI
2025
Data Platform And Pipeline Design
Learn Data Engineering
2026
SQL For Data Engineers
Learn Data Engineering
2026